Viewing Your SEO Report
Essential Clients (with SEO Reporting)
How to view your SEO report in your user dashboard- Log in to your dashboard
- Click SEO Report
- In the Google analytics section, click “view full report“
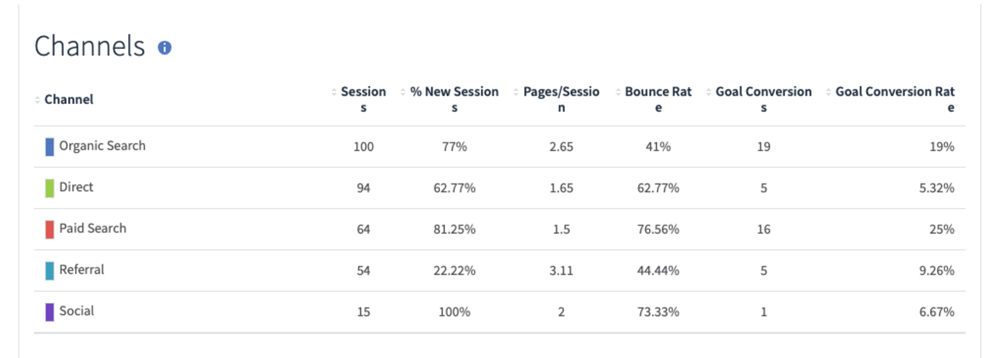
- Click the “Channels” tab, and “select last 30 days”
- Scroll to the bottom of this section, where you’ll see something like this:

Premium Plan Clients
Logging into your Analytics Report dashboard- Login to the reports platform. The main dashboard page will show a snapshot of your rankings and traffic.
- You can dig deeper into the rankings by clicking “Rankings” under ‘SEO’.
- See your Analytics broken down by clicking “Google Analytics” under ‘Analytics’.
- See your Google Business Profile stats broken down by clicking “Google Business Profile” under ‘Local’.
If you have any issues finding the information you’re looking for, contact your Digital Marketing Specialist and they’ll be happy to walk you through.
Understanding The Numbers
There are a lot of numbers we can look at in analytics to see how a website is performing but there are a handful that give us the best understanding of how a site is performing and what improvements could be made.
In the channels tab of your Google analytics section of your SEO report, you can see information for organic traffic, direct traffic, paid search, referral and social.
Total Sessions
A session is a website visit, a series of interactions with the site (visiting pages, clicking buttons etc) within a given time frame. This section shows the total amount of sessions for the time period selected. This includes all traffic sources, but in SEO we only focus on organic traffic.
This is why we want to look at “Total Organic Sessions”, which is the total visits to the website from search engines (like Google) only.
This is important because organic traffic drives most of our new patient growth. Monitoring this number gives us an indication of how many potential new patients are visiting the site from organic sources like Google in the selected time period.
Its also important to know that this number depends on a lot of factors like search volume for your main keywords, population numbers in your location, and your current rankings.
Every site will have varying organic traffic session numbers, and what is good for one site might not be good for another and vice versa.
% New Sessions
% New Sessions
This shows you what percentage of sessions came from people who, generally speaking have not been to your website before or have not been for a long time. This is a good indicator of potential new patient traffic.
Pages/Session From Organic
Pages/Session From Organic
This is the average number of pages viewed by a visitor in their session coming from organic traffic sources.
Bounce Rate % From Organic
Bounce Rate % From Organic
Bounce rate by definition is “the percentage of visitors to a particular website who navigate away from the site after viewing only one page”. It’s a very important statistic, and as a guide anything under 50% from organic traffic is great.
If your bounce rate from organic traffic is high, and this is consistent month over month, it could mean you’re getting traffic from suburbs that are not the most relevant or there’s something on the home page of the site that’s turning off visitors or making them click away.
Total Goal Conversion
Total Goal Conversions
The total number of goal completions for this time period. Goal completions are usually unique contact us page visits.
Goal Conversion % Rate From Organic
Goal Conversion % Rate From Organic
This is the percent of visitors coming to the site who are visiting the contact page as part of their session, from organic traffic. (It generally doesn’t track visits coming to the contact page directly, since those would usually be returning visitors.) If someone is visiting a contact us page, it stands to reason they’re looking to contact the practice.
Looking at contact page views is a good way to roughly gauge potential new patient numbers. We set up a goal in analytics (for all Premium clients ) to look at the conversion rate of people visiting the site and then visiting the contact us page.
If contact us page visits are low, generally speaking most of the other numbers will also be low. If the site is doing well in all other metrics but contact page visits are low, it could be that you have a booking link somewhere on your site siphoning off this traffic or you have a very old design that isn’t optimized for conversion.
If contact page visits are high when compared to new user numbers, the site is generally converting a lot of that new user traffic into contact page visits and this is a good thing.
In terms of a good goal conversion rate, generally anything over 15% is good. 20% is great and anything over that from organic traffic is very positive.
Still have questions? Don’t hesitate to call or contact us at support@perfectpatients.com.
We look forward to hearing from you!